Hi guys!
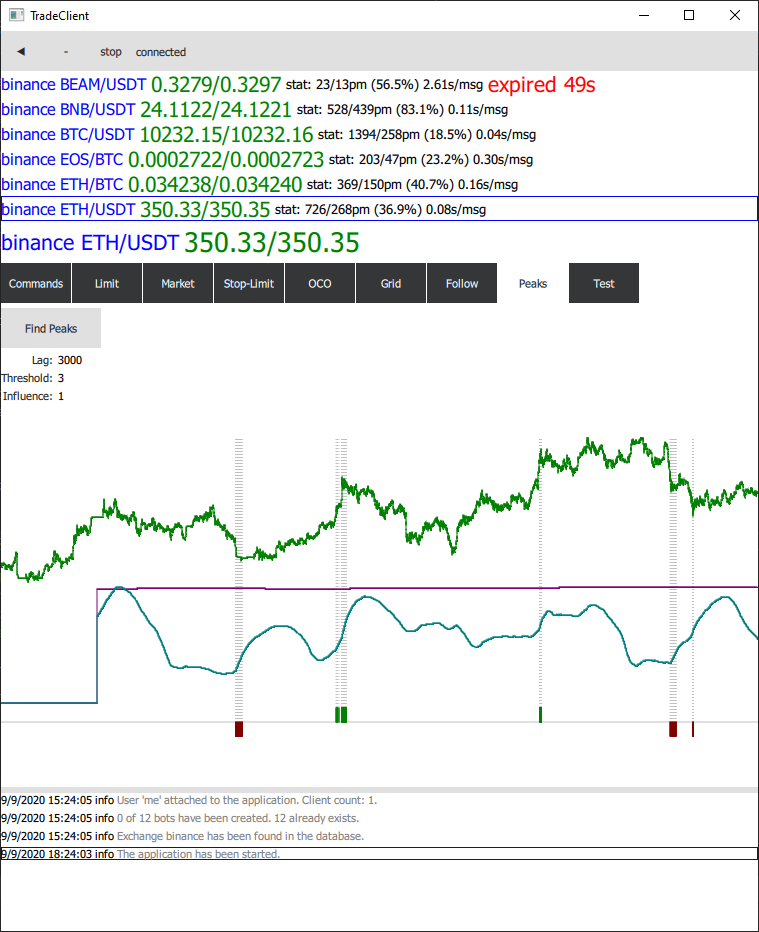
For those how are interested in what I am doing now I provided my app screenshots with ‘Find Peaks’ button that runs ZScore algorithm on a cryptocurrency market data (follow the this link for the algorithm source code in C++).
Honestly I am not quite enough understand yet how it works, because I run it first time today, but at least there is some correlation between input parameters and the results. The lesser the threshold and the longer the lag the lesser peaks are found. Increasing the influence also reduces the peak count.
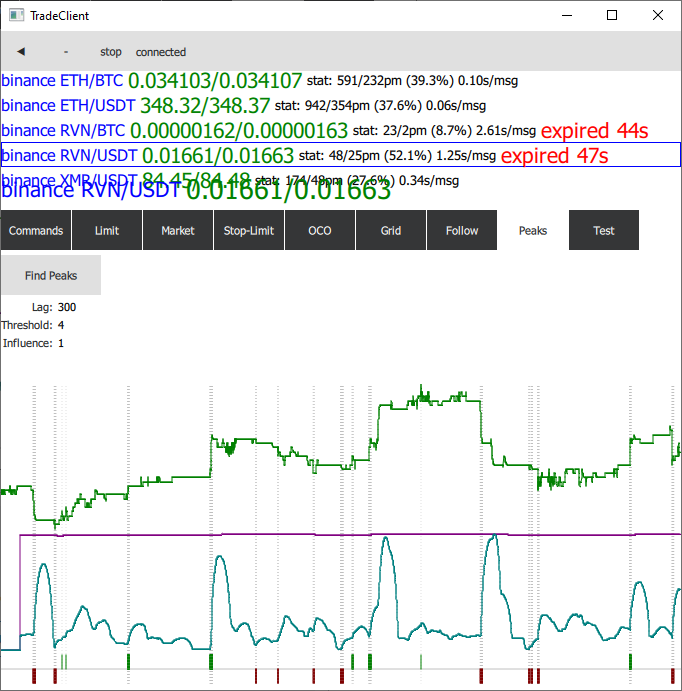
At the screenshot below 14 positive and 0 negative peaks are found in Ethereum price:
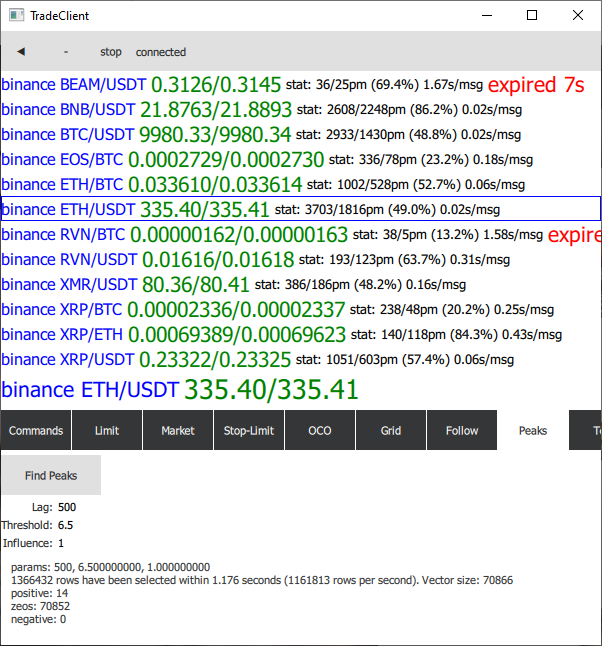
Shortly and probably not quite exactly, the algorithm calculates moving z-score with a window of size specified with lag parameter and signals if z-score is greater than the threshold. influence parameter (between 0 and 1) is the influence of new signals on the mean and standard deviation.
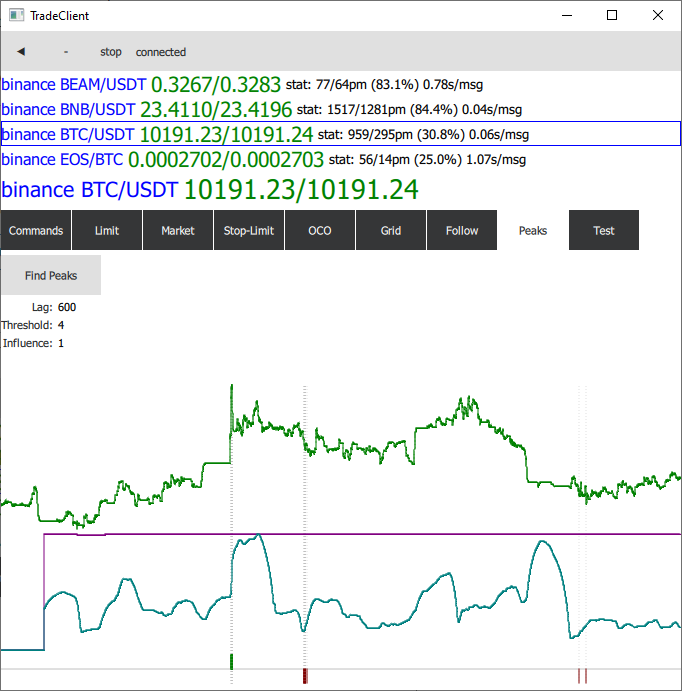
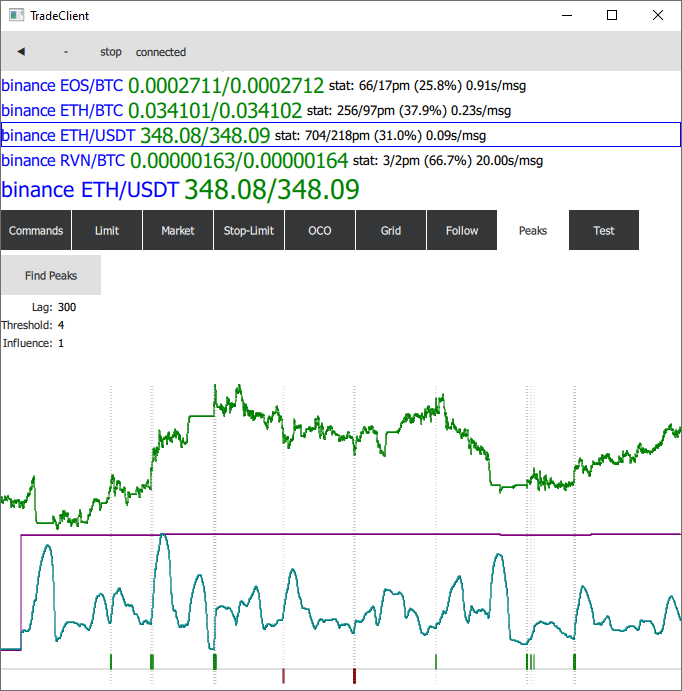
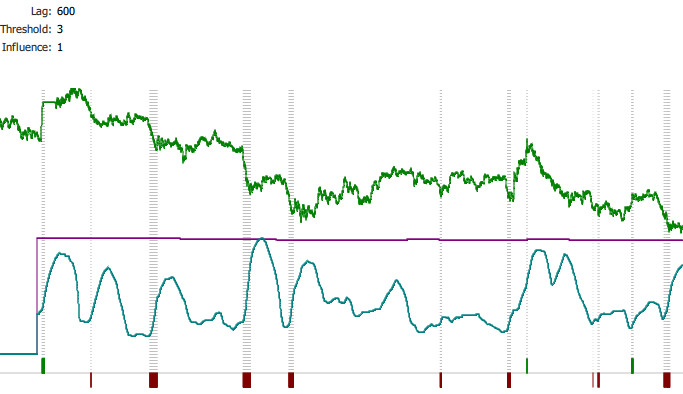
The next day I wrote some C++ code that visualizes the results:
- green – the price
- cyan – the standard deviation
- magenta – the mean
and below the signals (green – positive, red – negative).
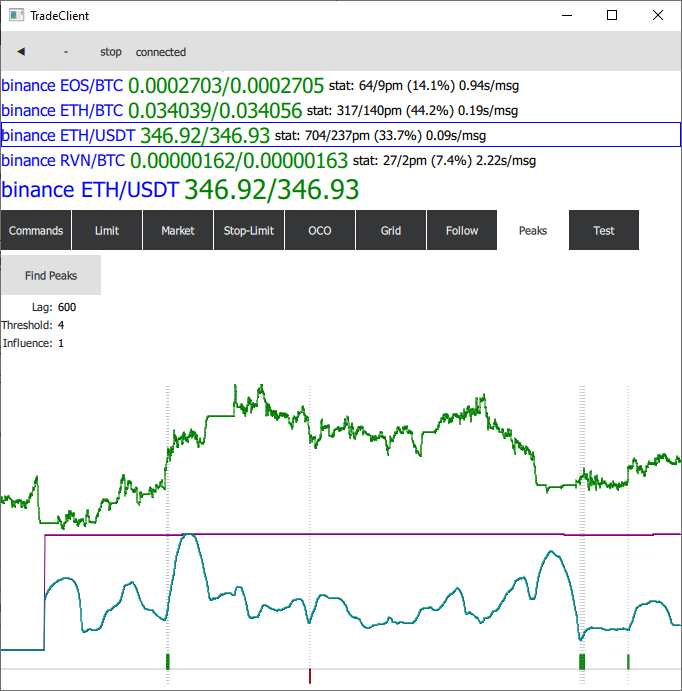
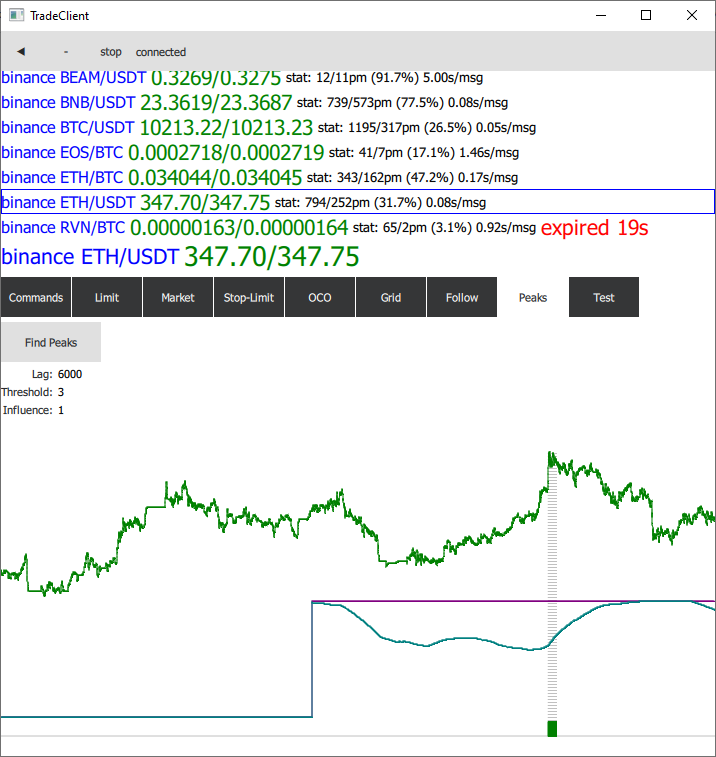
An interesting result with ETH and lag 6000:
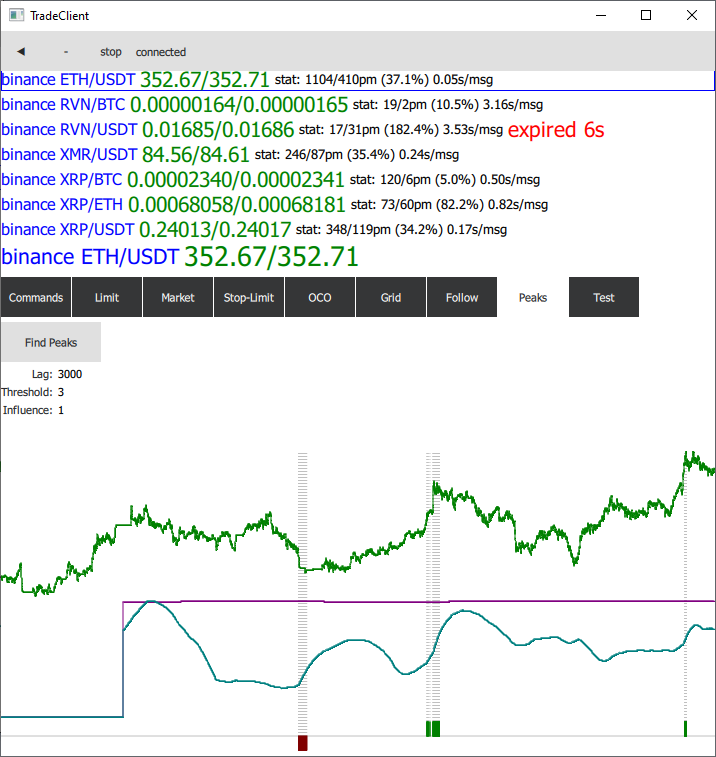
lag 3000:
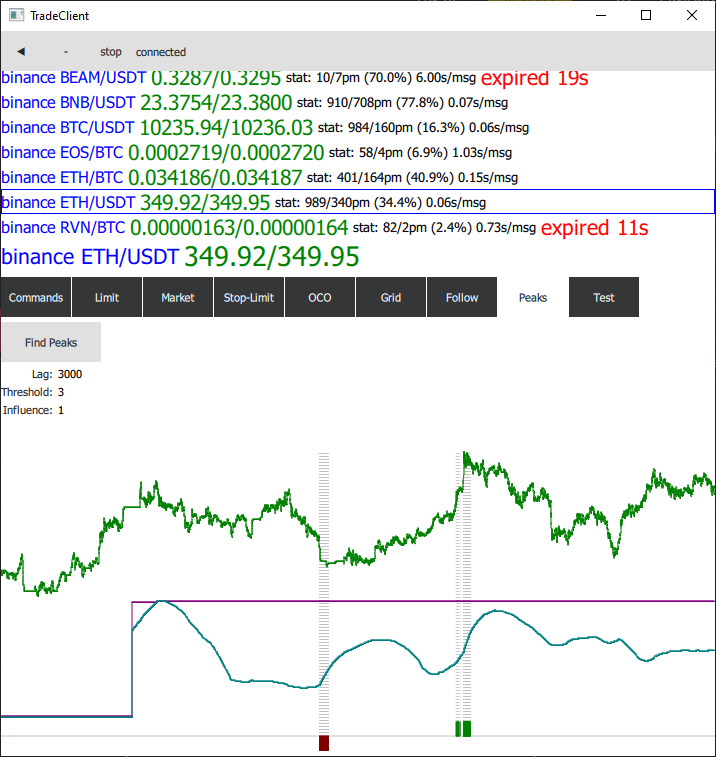
within some time after that it detected another peak:
and yet another peak:
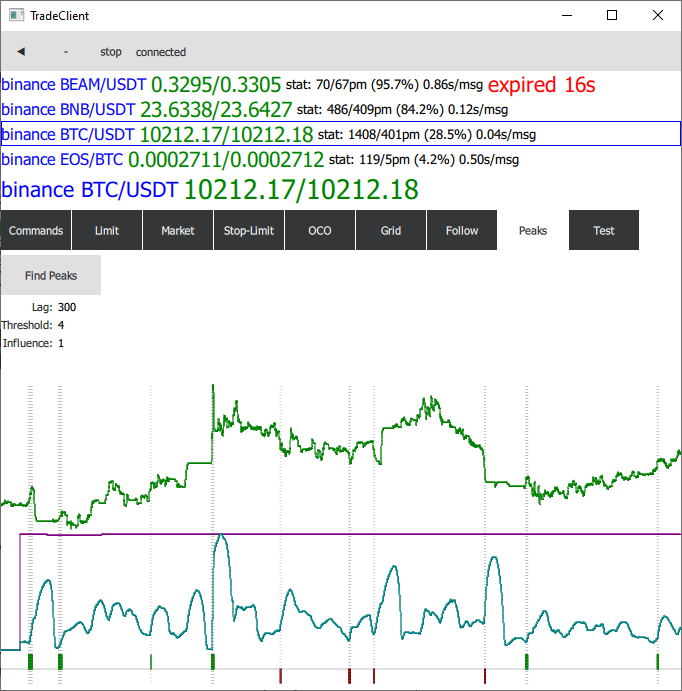
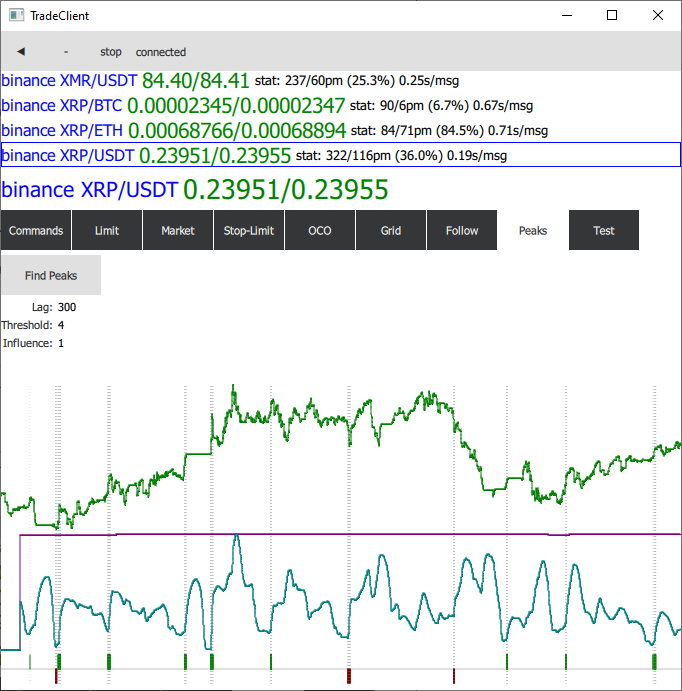
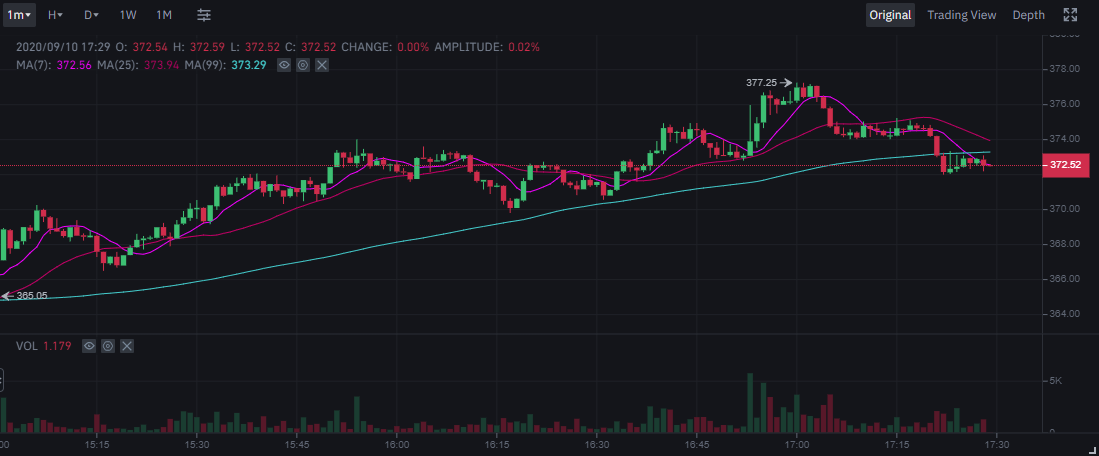
On the third day I did some experimentation with lag=100. Below I provided the screenshot of OHLCV chart from Binance and my app:
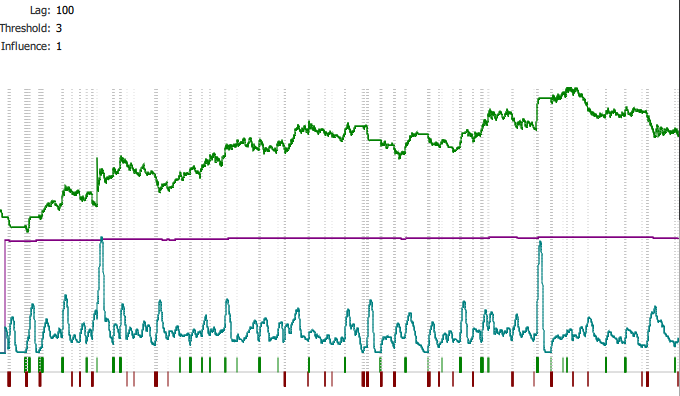
as you can see, it detects small price moves that can be inside a flat or can be at the starting point or a larger move.
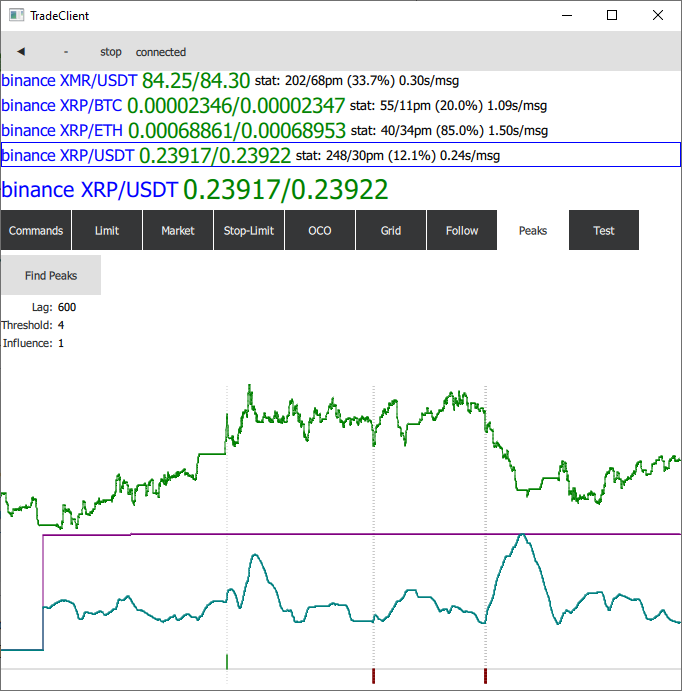
Another example of lag=100:
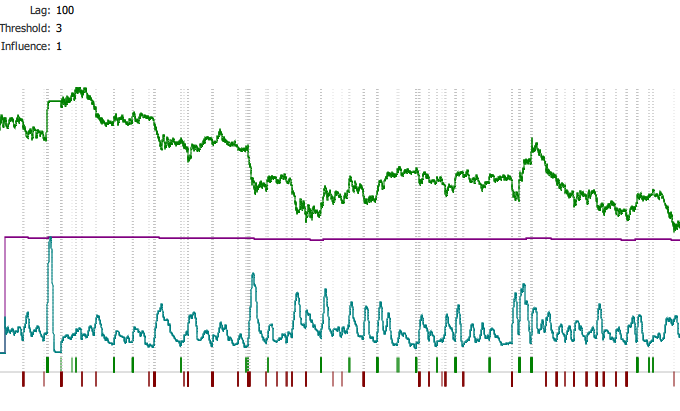
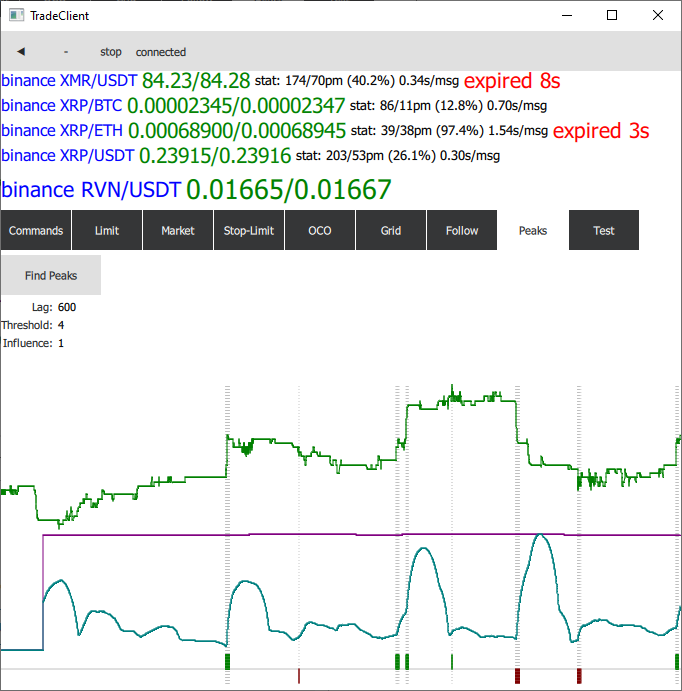
compare it with lag=600:
Now I need to investigate how it works 🙂 I am becoming a data scientist 🙂
Leave your comment below if you have some knowledge about this.
Performance
I modified the original C++ code a bit and got the following performance:
with lag=600:
qml: params =  ZScoreParams(600, 3, 1)
398291 rows have been selected within 0.054 seconds (7432425 rows per second). Vector size: 24363

params: 600, 3.000000000, 1.000000000
ZScore with 24363 values has taken 0.027 seconds (918409 rows per second).
positive: 551
zeos: 23503
negative: 309
with lag=3000:
qml: params =  ZScoreParams(3000, 3, 1)
398471 rows have been selected within 0.054 seconds (7427482 rows per second). Vector size: 24381

params: 3000, 3.000000000, 1.000000000
ZScore with 24381 values has taken 0.119 seconds (204470 rows per second).
positive: 180
zeos: 23857
negative: 344
With a circular buffer copied from here it work 10 times slower:
params: 600, 3.000000000, 1.000000000
ZScore with 30740 values has taken 0.228 seconds (134865 rows per second).
positive: 690
zeos: 29510
negative: 540

params: 3000, 3.000000000, 1.000000000
ZScore with 30747 values has taken 1.059 seconds (29022 rows per second).
positive: 663
zeos: 29740
negative: 344