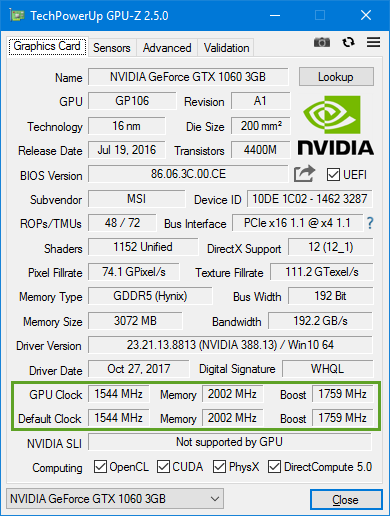
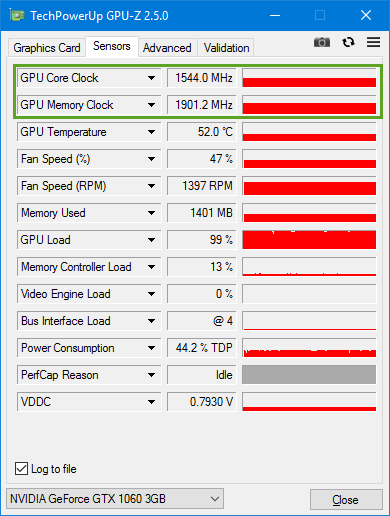
MSI GeForce GTX 1060 3GB graphic card does not trigger its boost state when its GPU is loaded at 99-100% with NiceHash miner. Compare the values in the green rectangles:
MSI GeForce GTX 1060 3GB graphic card does not trigger its boost state when its GPU is loaded at 99-100% with NiceHash miner. Compare the values in the green rectangles:
Today I got 504 Gateway Timeout error while updating my Joomla website and solved this issue by adding “fastcgi_read_timeout 300” into Nginx virtual host:
location ~ \.php$ {
    fastcgi_split_path_info ^(.+\.php)(/.+)$;
    fastcgi_pass unix:/run/php/www-shar.sock;
    fastcgi_index index.php;
    include fastcgi.conf;
    fastcgi_read_timeout 300;
}
I already had request_terminate_timeout option set to 300s in the pool configuration file:
; The timeout for serving a single request after which the worker process will
; be killed. This option should be used when the 'max_execution_time' ini option
; does not stop script execution for some reason. A value of '0' means 'off'.
; Available units: s(econds)(default), m(inutes), h(ours), or d(ays)
; Default Value: 0
request_terminate_timeout = 300s
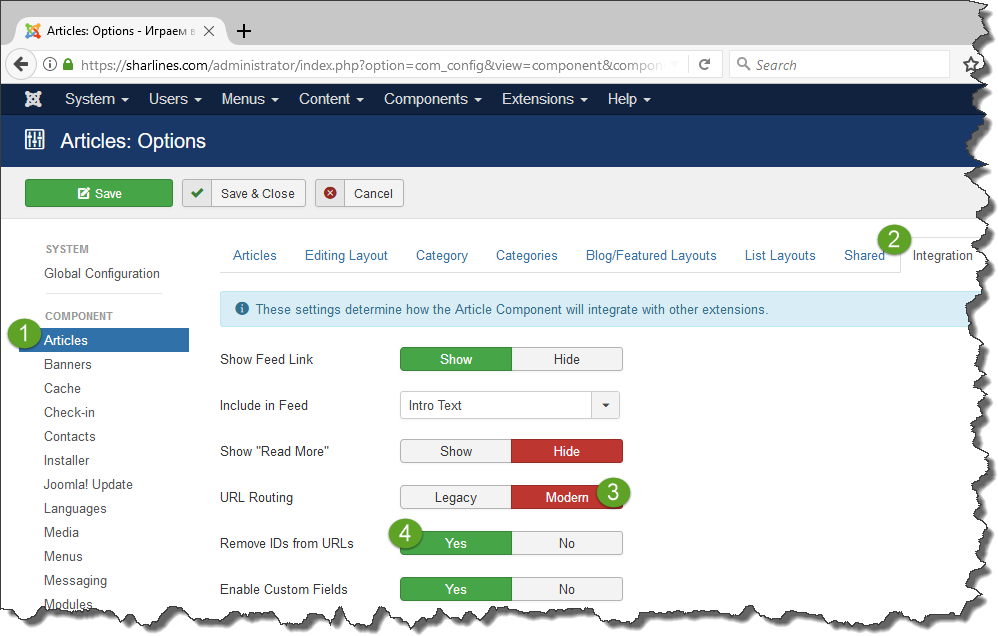
In Joomla 3.8.2 (and probably 3.8) or later to remove ID from URL you go to System->Global Configuration->Articles->Integration page, select Modern URL Routing and then select Remove IDs from URLs:
Today I read that Postfix can be better than sendmail and found a great Russian article on how to configure Postfix to work with Yandex.ru relay (Yandex.ru is some kind of Russian Google). The only notice I would give is that in a Docker container I need also install rsyslog, otherwise /var/log/mail.log file is not created:
apt install rsyslog
After doing all the steps described in this Russian manual I was able to send email to Yandex.ru and GMail accounts, but GMail landed all the emails to its spam folder. My first idea was that it is because I did not configure ‘from address’ correctly, so I had the following in /var/log/mail.log, and also there was a message ‘Cannot assign requested address‘:
Oct 27 11:36:19 0675c97b78aa postfix/pickup[1210]: 8C7ECE5B72: uid=0 from=<root>
Oct 27 11:36:19 0675c97b78aa postfix/cleanup[10786]: 8C7ECE5B72: message-id=<20171027113619.8C7ECE5B72@0675c97b78aa.localdomain>
Oct 27 11:36:19 0675c97b78aa postfix/qmgr[1211]: 8C7ECE5B72: from=<root@0675c97b78aa.localdomain>, size=405, nrcpt=2 (queue active)
Oct 27 11:36:19 0675c97b78aa postfix/smtp[10788]: connect to gmail-smtp-in.l.google.com[2a00:1450:400c:c09::1b]:25: Cannot assign requested address
...
Previously I published post How I configured sendmail for PHP on Ubuntu Server 12.04 describing how to configure sendmail to use custom SMTP server. But after switching to Ubuntu 16.04 VPS my first idea was that I can use sendmail in its default configuration, but this idea was wrong, because while sendmail worked well with yandex.ru (some Russian mail server), for example, it did not work with GMail, because GMail did not accept the mail reporting ‘DSN: Service unavailable.‘ in /var/log/mail.log, see my post on Ubuntu Forum for more information. Now my second idea is that using GMail as sendmail relay will prevent GMail from rejecting my mail. Below I provided a short instruction on how to realize this successful idea.
apt-get install sendmail mailutils
mailutils allows to run mail command.
I have heard many times that there are a lot of Russian guys who build mining farms and earn money with cryptocurrencies. Who knows, probably cryptocurrencies are still only at the starting point of their growth, or probably it is too late to start mining, or as another alternative Russian government will forbid them, but anyway it was interesting for me, how much Bitcoins my home Windows computer with relatively old graphic card can mine.
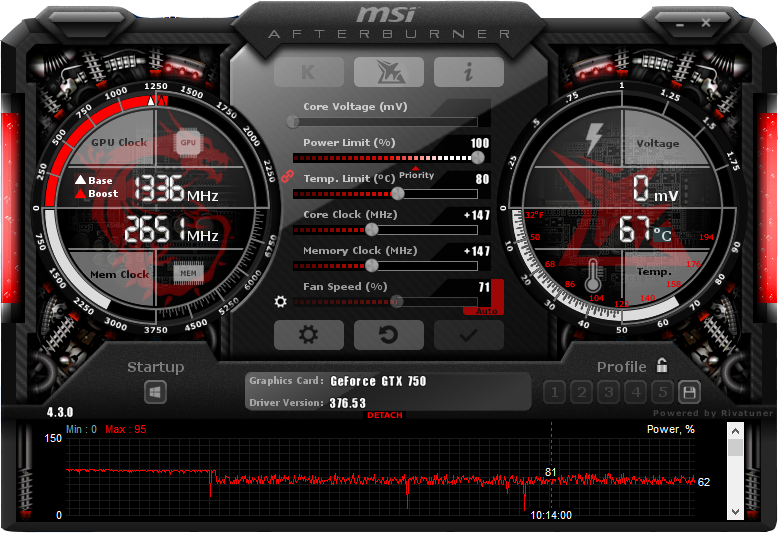
I overclocked my GeForce GTX 750 graphics card a bit:
Once std::vector is filled (size() equals to capacity()), a subsequent push_back(…) results in an exponential expansion of the vector capacity. The following table shows that the expansion happens when the index reaches a power of two:
index: 0, capacity: 1, address: 0x1fa6c20
index: 1, capacity: 2, address: 0x1fa6c40
index: 2, capacity: 4, address: 0x1fa6c20
index: 4, capacity: 8, address: 0x1fa6c60
index: 8, capacity: 16, address: 0x1fa6c90
index: 16, capacity: 32, address: 0x1fa6ce0
index: 32, capacity: 64, address: 0x1fa6d70
index: 64, capacity: 128, address: 0x1fa6e80
index: 128, capacity: 256, address: 0x1fa7090
index: 256, capacity: 512, address: 0x1fa74a0
index: 512, capacity: 1024, address: 0x1fa7cb0
index: 1024, capacity: 2048, address: 0x1fa8cc0
index: 2048, capacity: 4096, address: 0x1faacd0
index: 4096, capacity: 8192, address: 0x1faece0
index: 8192, capacity: 16384, address: 0x1fb6cf0
index: 16384, capacity: 32768, address: 0x1fc6d00
index: 32768, capacity: 65536, address: 0x1fe6d10
index: 65536, capacity: 131072, address: 0x2026d20
index: 131072, capacity: 262144, address: 0x20a6d30
index: 262144, capacity: 524288, address: 0x21a6d40
index: 524288, capacity: 1048576, address: 0x23a6d50
index: 1048576, capacity: 2097152, address: 0x27a6d60
index: 2097152, capacity: 4194304, address: 0x2fa6d70
index: 4194304, capacity: 8388608, address: 0x7f8e9225f010
index: 8388608, capacity: 16777216, address: 0x7f8e8e25e010
index: 16777216, capacity: 33554432, address: 0x7f8e8625d010
index: 33554432, capacity: 67108864, address: 0x7f8e7625c010
index: 67108864, capacity: 134217728, address: 0x7f8e5625b010
index: 134217728, capacity: 268435456, address: 0x7f8e1625a010
index: 268435456, capacity: 536870912, address: 0x7f8d96259010
index: 536870912, capacity: 1073741824, address: 0x7f8c96258010
The following C++ code demonstrates how to erase an element a reverse iterator points to:
#include <iostream>
#include <set>
#include <cassert>

int main()
{
    std::set<int> set;

    set.insert(15);

    std::cout << set.size() << " ";

    auto ri = set.rbegin();

    auto i1 = --ri.base();

    auto i2 = --set.end();

    assert(i1 == i2);

    set.erase(i1);

    std::cout << set.size() << std::endl;
}
The output is ‘1 0’. The key point here is that the reverse iterator is an adaptor for reverse-order traversal that can be created from forward iterator with std::make_reverse_iterator.
The following simple code C++ example can be used for investigation of how GCC thread sanitizer works:
#include <mutex>
#include <atomic>
#include <iostream>
#include <thread>

std::mutex mutex;
int a = 3;
const size_t size = 1000 * 1000;
std::atomic<int> b(1);

void testA()
{
	for (size_t counter = 0; counter < size; counter++)
	{
		++b;
		std::unique_lock<std::mutex> lock(mutex);
		++a;
	}
}

void testB()
{
	for (size_t counter = 0; counter < size; counter++)
	{
		--b;
		std::unique_lock<std::mutex> lock(mutex);
		--a;
	}
}

int main()
{
	std::thread t1(testA);
	std::thread t2(testB);
	t1.join();
	t2.join();
}
I wrote a sample application using OsgQtQuick that shows the Earth in two views:
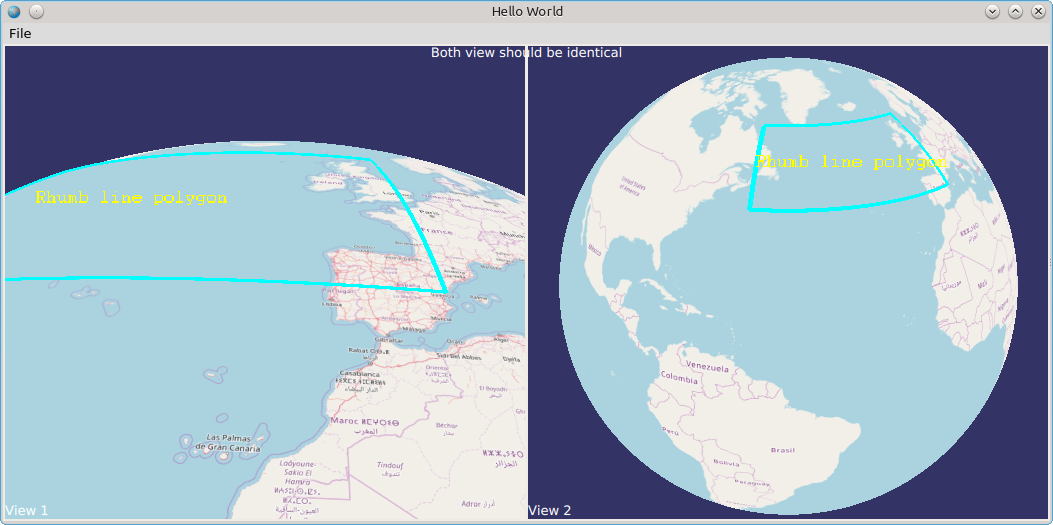
with the following QML, that I copied from OsgQtQuick samples: