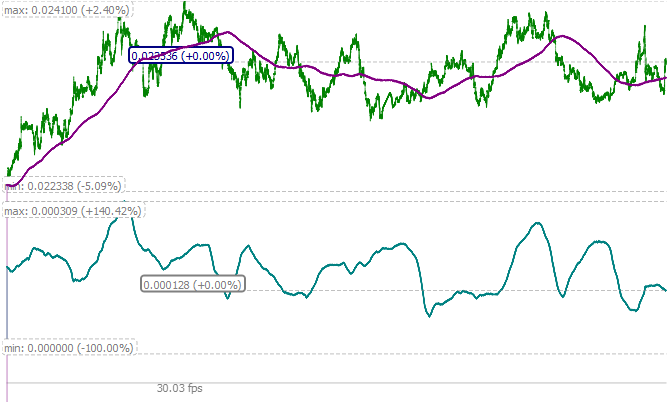
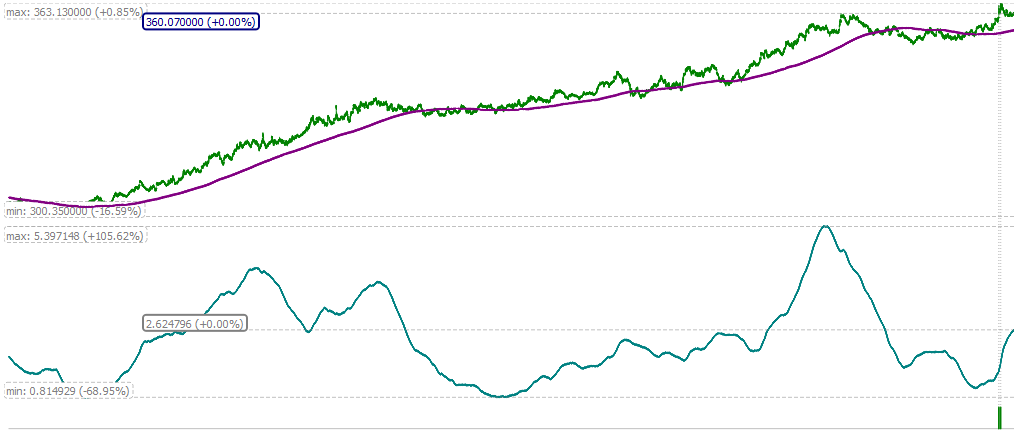
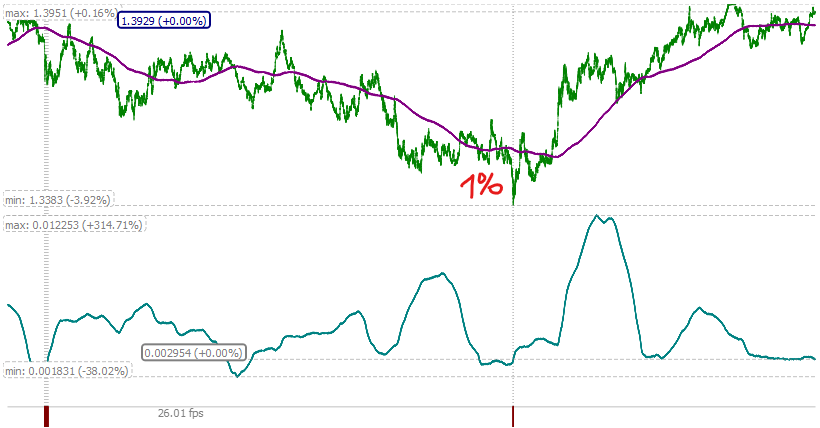
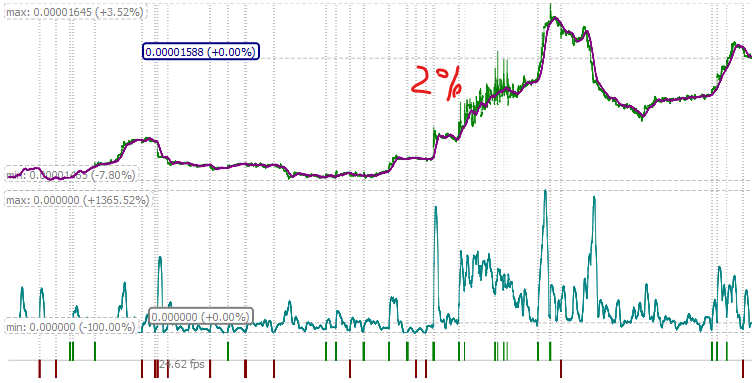
The basic idea is to calculate the difference with 10 minutes (600 seconds) moving and the current price, for example.
ASR/USDT:
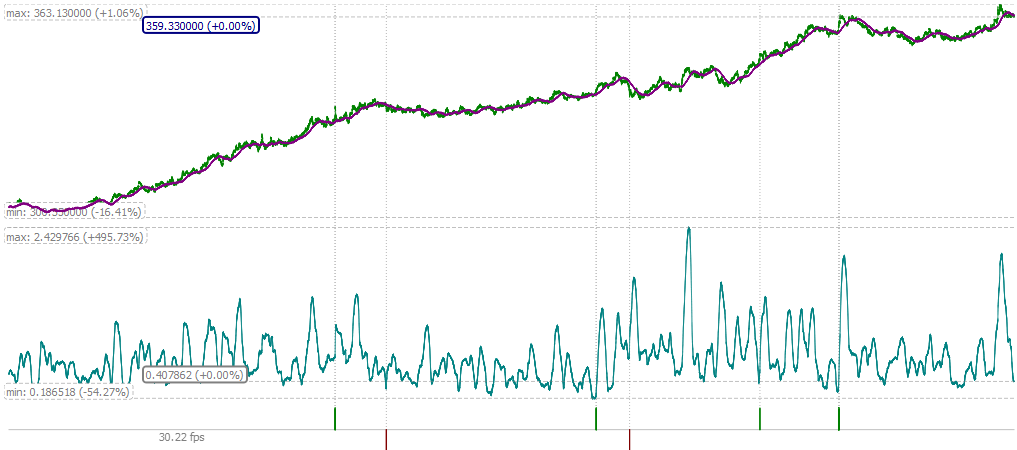
it also can be 9000 moving:

NXS/BTC:
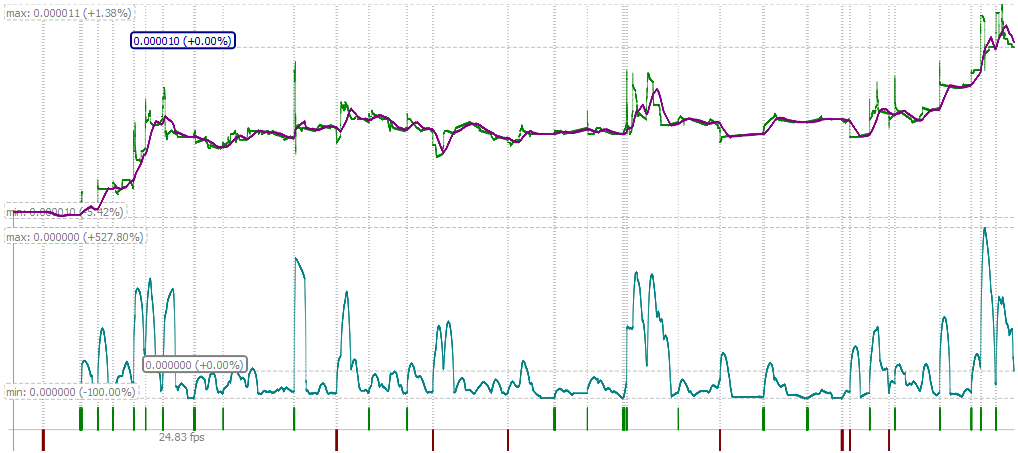
9000 moving:

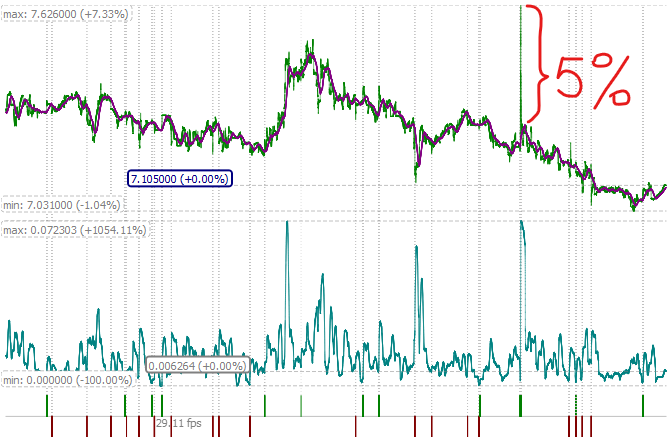
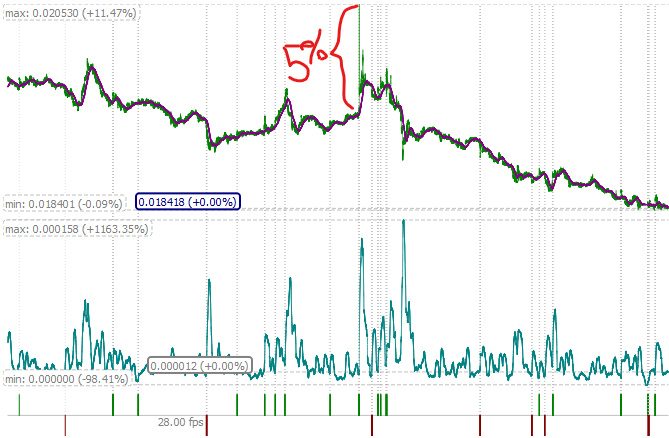
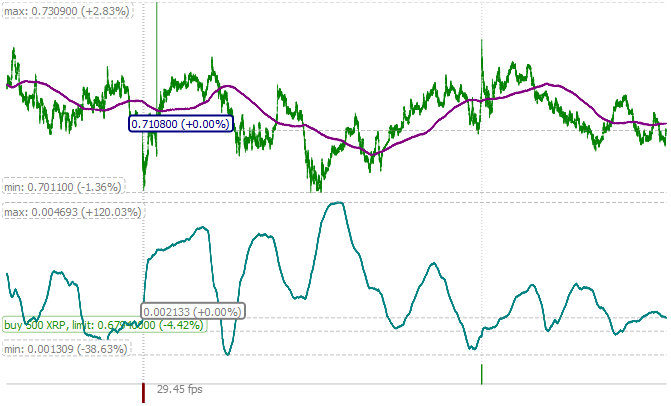
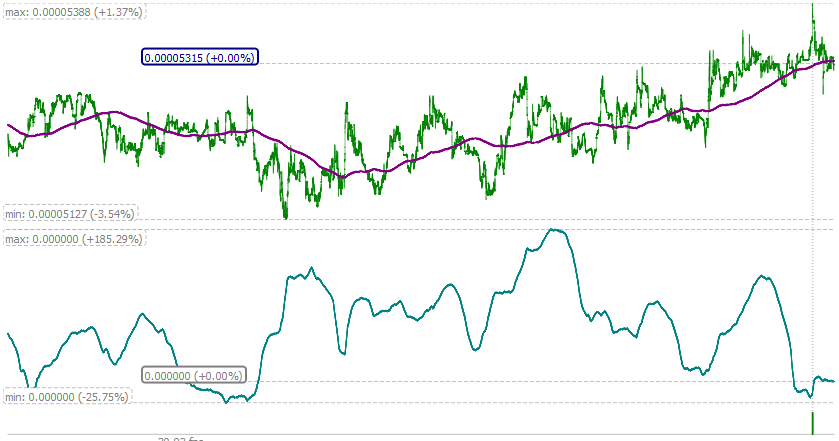
XRP/USDT:

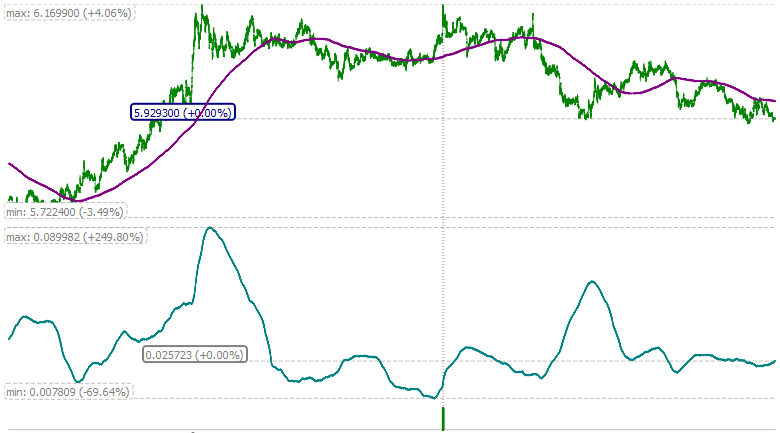
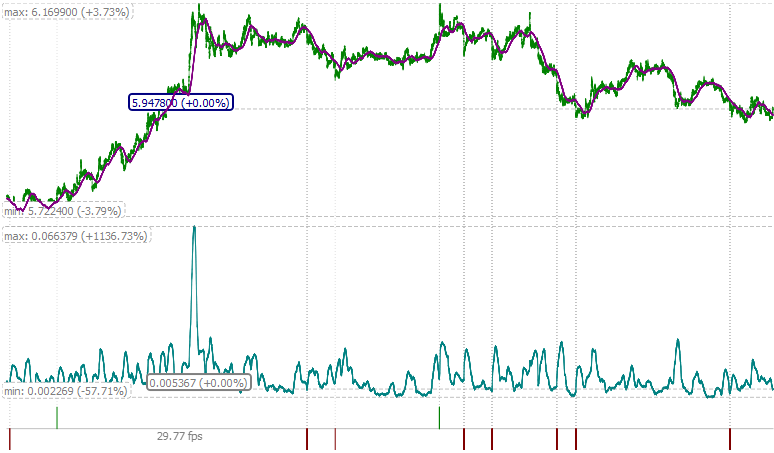
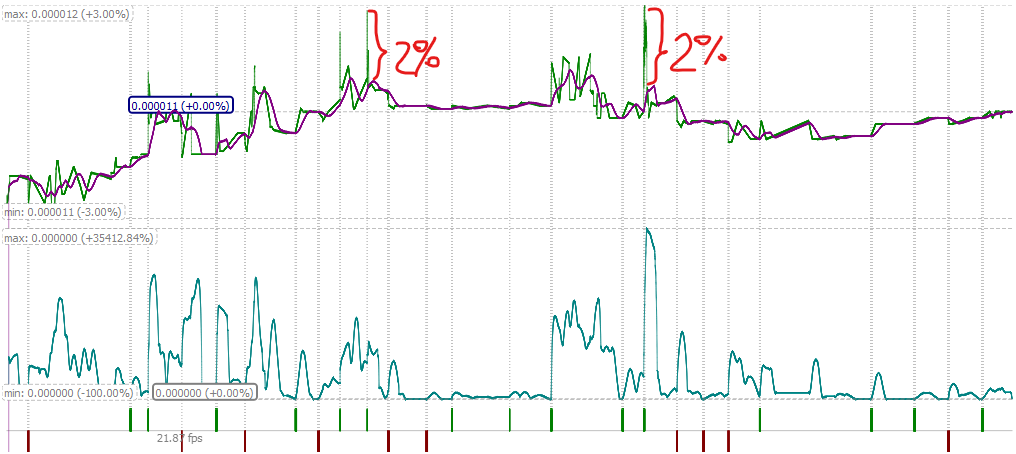
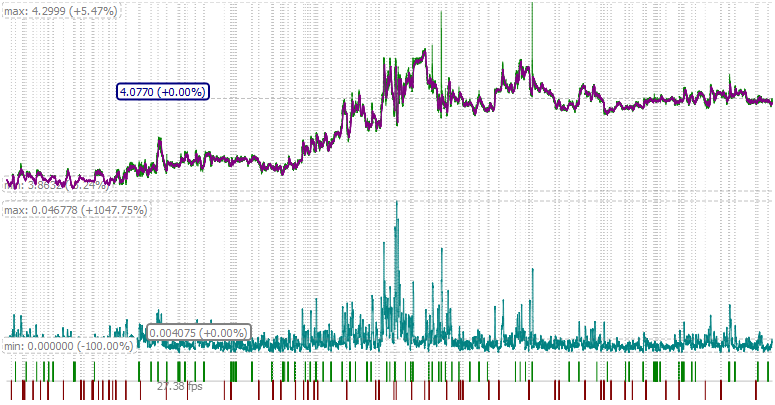
KAVA/USDT (moving 600):
moving 1200:
FUN/USDT:

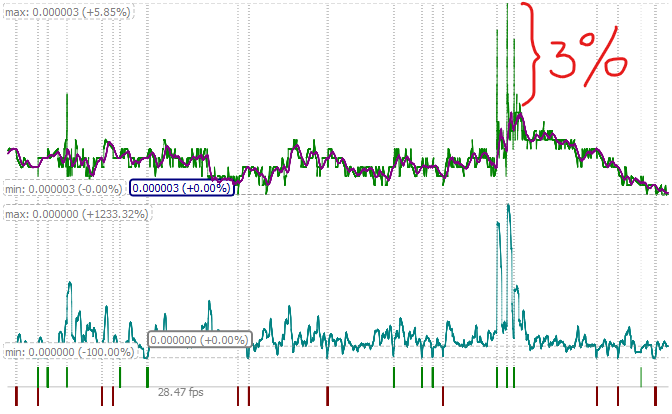
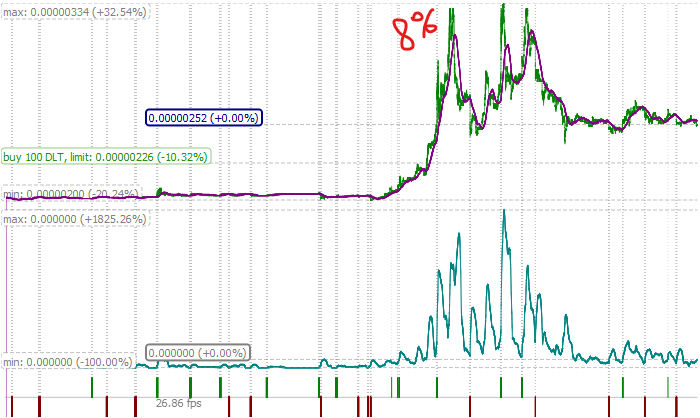
DNT/BTC:
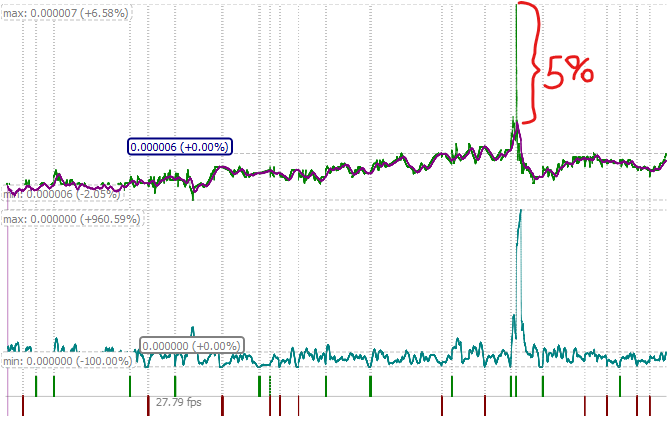
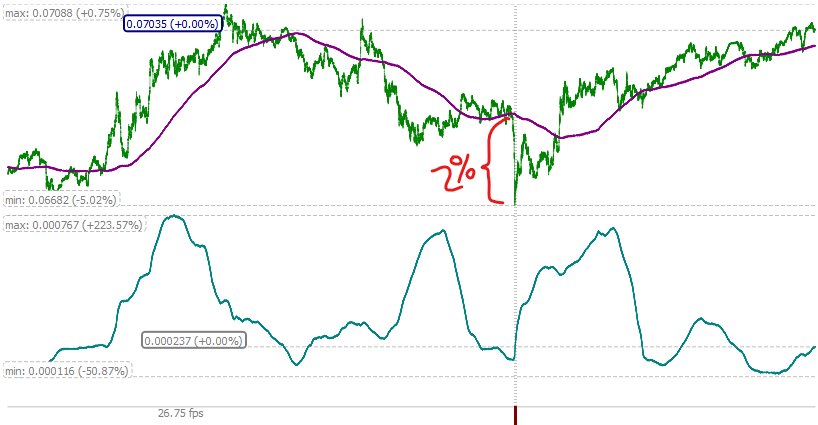
CVC/BTC:
Trading a flat can be based on the same idea:
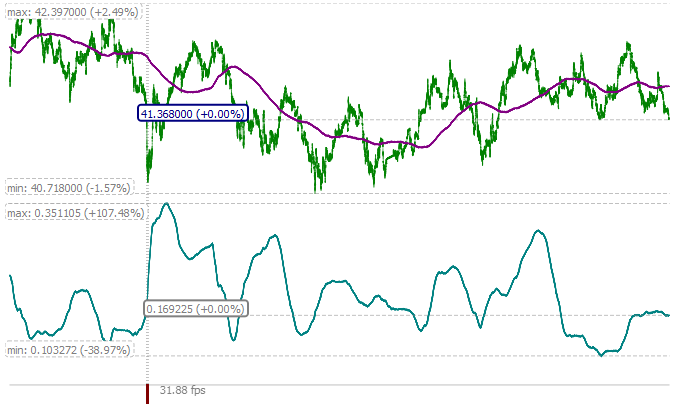
NEO/USDT:
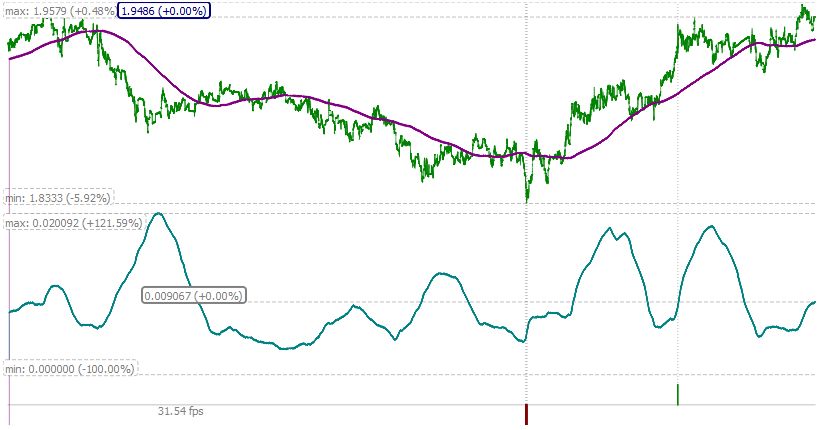
AKRO/USDT:
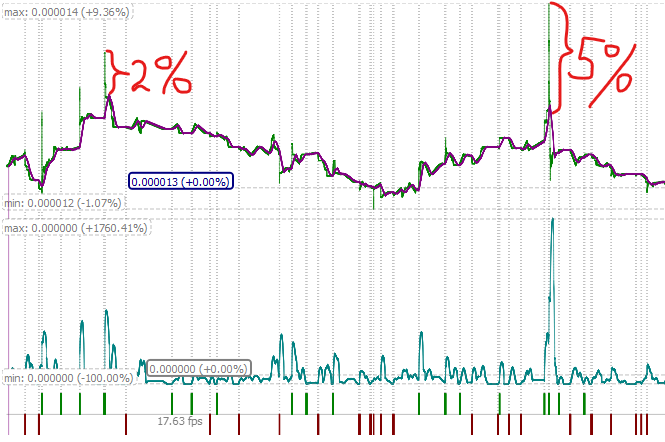
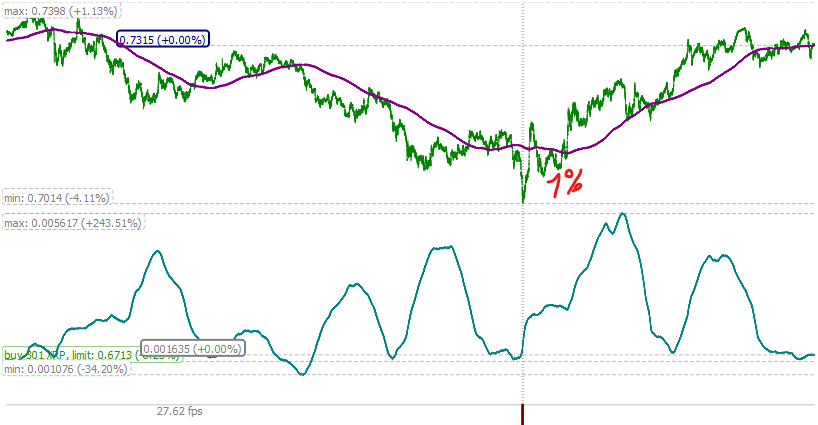
XRP/USDT:
KAVA/USDT (9000 moving):
900 moving:
AAVE/USDT (9000 moving):
900 moving:
NAV/USDT (900 moving):
VIA/BTC:
DLT/BTC (moving 900):
STRAX/USDT (9000 moving):
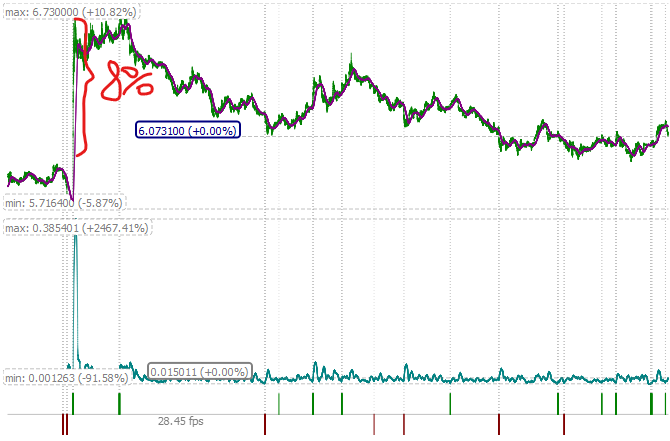
XRP/USDT:
TRX/USDT:
ADA/USDT:
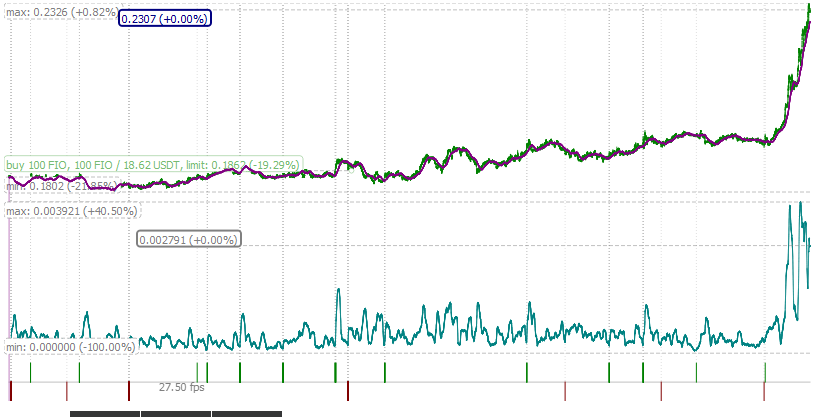
FIO/USDT (9000 moving):
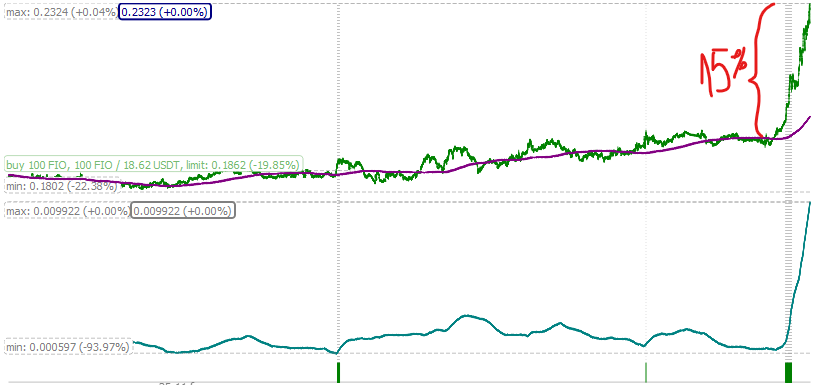
600 moving (no signal):
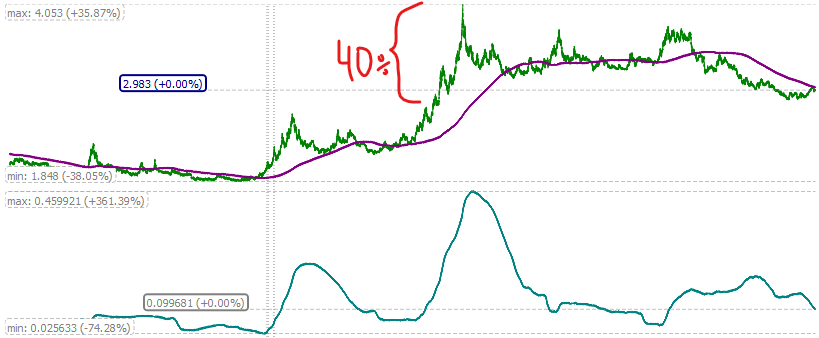
FIS/BTC 9000 moving, no signal when it grown in 40%:
PIVX/BTC 600 moving:
BCD/BTC 9000 moving:
LSK/USDT 100 moving:
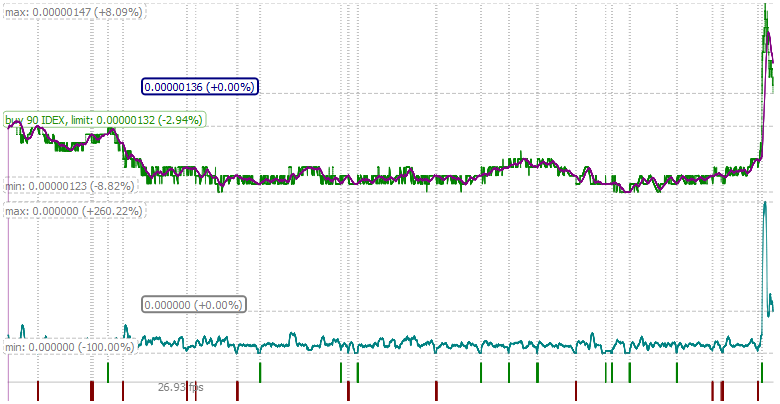
IDEX/BTC 100 moving:
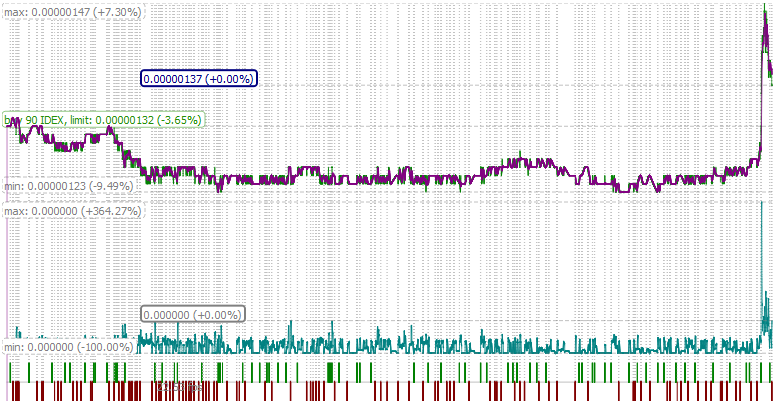
600 moving: